2606:4700:f1::1 / time.cloudflare.com
איזורים:
@
ao
ar
asia
at
au
be
bg
bh
br
ca
cl
cn
cy
cz
de
dk
dz
es
europe
fi
fr
gd
ge
gh
gr
hk
ie
in
is
it
jp
ke
kh
kz
lk
lu
lv
mg
mn
nc
nl
no
north-america
np
nz
oceania
ph
pl
ps
pt
py
qa
ro
ru
se
sg
south-america
sr
tr
ua
uk
us
תוצאה נוכחית: 20.0 (רק שרתים עם תוצאה גבוהה מ-10 יהיו בשימוש ב-pool)
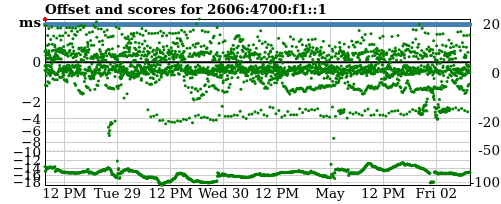
History
In the graph above the green, orange and red dots are offsets (in milliseconds, using the left axis).
The blue or red (bigger) dots are the
calculated scores (using the right axis).
Client distribution
The units are in permyriad (‱, 1/10000). "100" equals one percent of DNS queries from the specified country.
The countries are ordered by number of DNS queries from each country answered with the server's IP address. The second number is the server's permyriad of the overall "netspeed" for countries configured for the server. # 46613 , לוג CSV מה משמעות הגרפים?
גרף התוצאות
מספר פעמים בשעה, מערכת ה-pool בודקת את הזמן מהשרת שלך ומשווה אותו לזמן המקומי. נקודות יורדות אם לא ניתן להגיע אל השרת או אם היסט הזמן גדול מ-100 מילי-שניות (ביחס למערכות הניטור). ככל שההיסט גדול יותר, כך יורדות יותר נקודות.
הגרף נועד רק להיות כלי המחשה לטרנדים. עבור פרטים מדוייקים והתוצאות שקיבלה מערכת הניטור, אתה יכול ללחוץ על הקישור ללוג ה-CSV.
גרף ההיסט
מערכת הניטור פועלת בערך כמו לקוח SNTP (ראה גם: RFC 2030), כך שהיא יותר רגישה לשיהויי רשת אקראיים בין השרת הנדגם לבין מערכת הניטור ביחס למה ששרת ntpd רגיל יהיה.
מערכת הניטור יכולה להיות לא מדוייקת ב-10 מילי-שניות או יותר.