162.159.200.123 / time.cloudflare.com
ゾーン:
@
ao
ar
asia
at
au
be
bg
bh
br
ca
cl
cn
cy
cz
de
dk
dz
es
europe
fi
fr
gd
ge
gh
gr
hk
ie
in
is
it
jp
ke
kh
kz
lk
lu
lv
mg
mn
nc
nl
no
north-america
np
nz
oceania
ph
pl
ps
pt
py
qa
ro
ru
se
sg
south-america
sr
tr
ua
uk
us
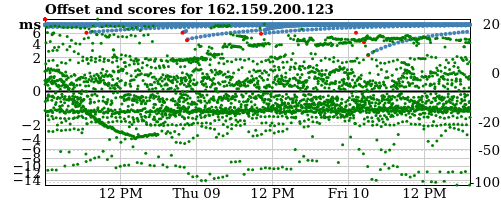
現在のスコア: 20.0 (10よりスコアの高いサーバだけがプールに使用されます)
History
In the graph above the green, orange and red dots are offsets (in milliseconds, using the left axis).
The blue or red (bigger) dots are the
calculated scores (using the right axis).
Client distribution
The units are in permyriad (‱, 1/10000). "100" equals one percent of DNS queries from the specified country.
The countries are ordered by number of DNS queries from each country answered with the server's IP address. The second number is the server's permyriad of the overall "netspeed" for countries configured for the server. # 46611 , CSVログ グラフが意味することは?
スコアグラフ
プールシステムは、1 時間に数回あなたのサーバから時刻を取得し、現在時刻と比較します。 サーバが応答しないか、監視システムと比較して時間のずれが 100 ミリ秒以上の場合、ポイントが減算されます。 オフセットが大きいほど更にポイントは差し引かれます。
グラフは傾向を視覚化するツールに過ぎません。 監視システムで検知したことの詳細を正確に知るため、CSV ファイルのリンクをクリックしてダウンロードできます。
オフセットのグラフ
監視システムは大まかには SNTP (RFC2030) クライアントのように動作します。 そのため、通常の ntpd サーバに比べ、サーバと監視システムの間のランダムなネットワーク遅延の影響をより鋭敏に受けます。
監視システムは、10 ミリ秒以上不正確になる可能性があります。