2400:8904::f03c:92ff:fe80:f6ac / ntp6.301-moved.de
Account: Max Grobecker (#32ffcnk)
ゾーン:
@
asia
in
✓
現在のスコア: 20.0 (10よりスコアの高いサーバだけがプールに使用されます)
History
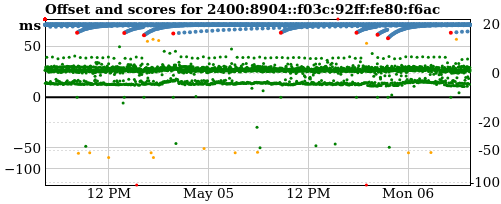
In the graph above the green, orange and red dots are offsets (in milliseconds, using the left axis).
The blue or red (bigger) dots are the
calculated scores (using the right axis).
Client distribution
The units are in permyriad (‱, 1/10000). "100" equals one percent of DNS queries from the specified country.
The countries are ordered by number of DNS queries from each country answered with the server's IP address. The second number is the server's permyriad of the overall "netspeed" for countries configured for the server. # 50513 , CSVログ グラフが意味することは?
スコアグラフ
プールシステムは、1 時間に数回あなたのサーバから時刻を取得し、現在時刻と比較します。 サーバが応答しないか、監視システムと比較して時間のずれが 100 ミリ秒以上の場合、ポイントが減算されます。 オフセットが大きいほど更にポイントは差し引かれます。
グラフは傾向を視覚化するツールに過ぎません。 監視システムで検知したことの詳細を正確に知るため、CSV ファイルのリンクをクリックしてダウンロードできます。
オフセットのグラフ
監視システムは大まかには SNTP (RFC2030) クライアントのように動作します。 そのため、通常の ntpd サーバに比べ、サーバと監視システムの間のランダムなネットワーク遅延の影響をより鋭敏に受けます。
監視システムは、10 ミリ秒以上不正確になる可能性があります。